Newsletter

Subscribe to our newsletter, The Littoral Lens, to dive into the latest trends on coastal risk modelling, engineering and resiliency efforts.

The technical edge behind every quote.

001
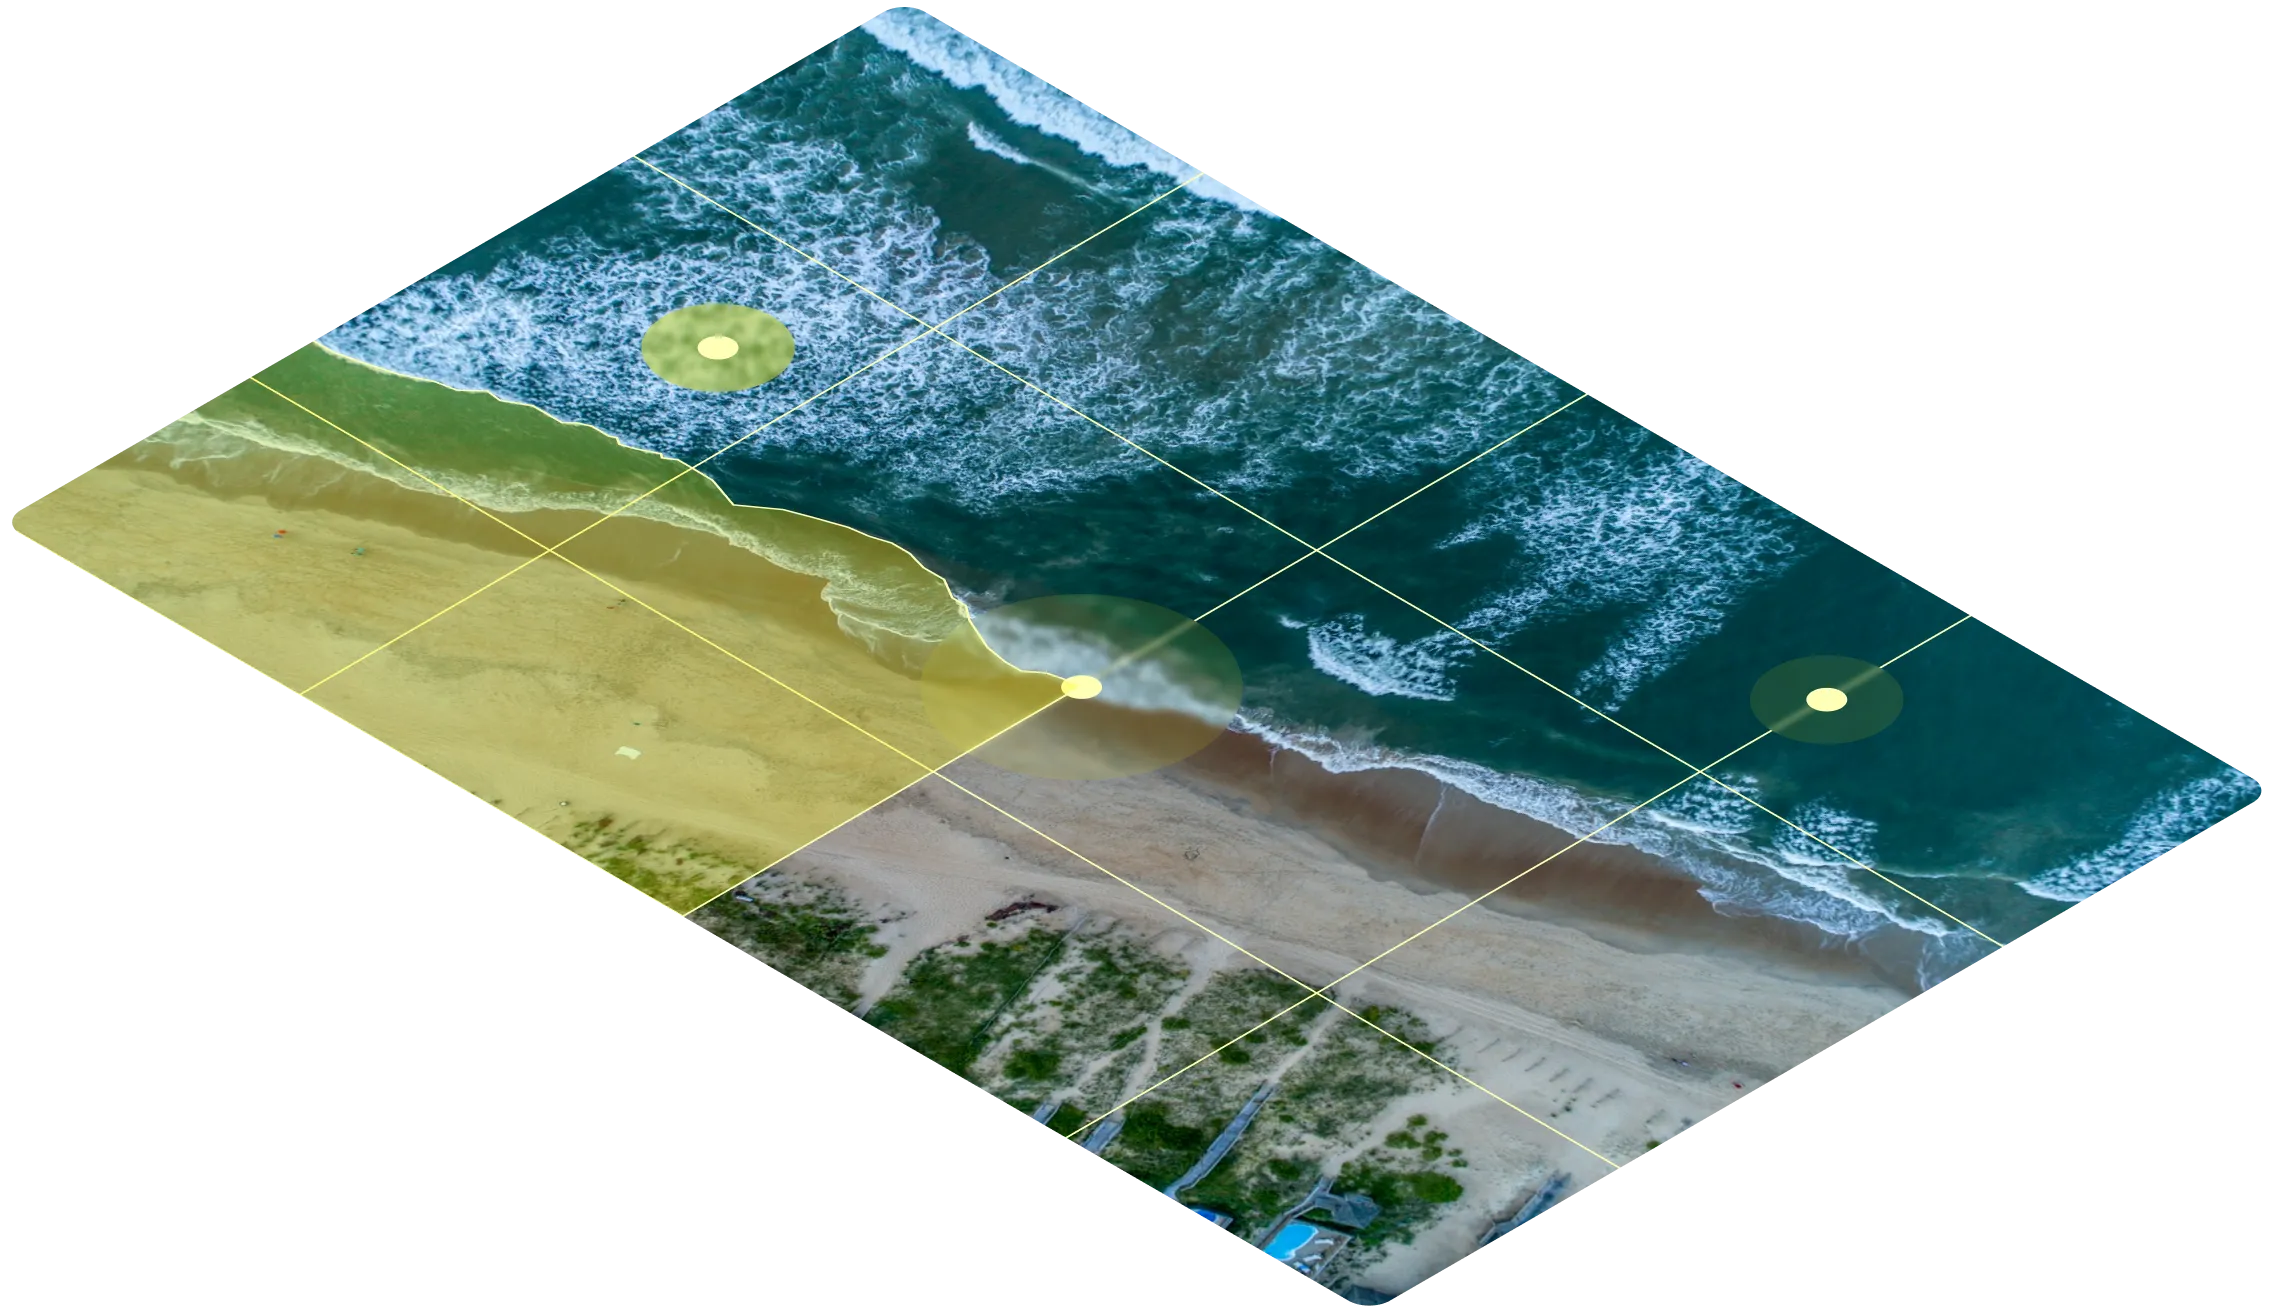
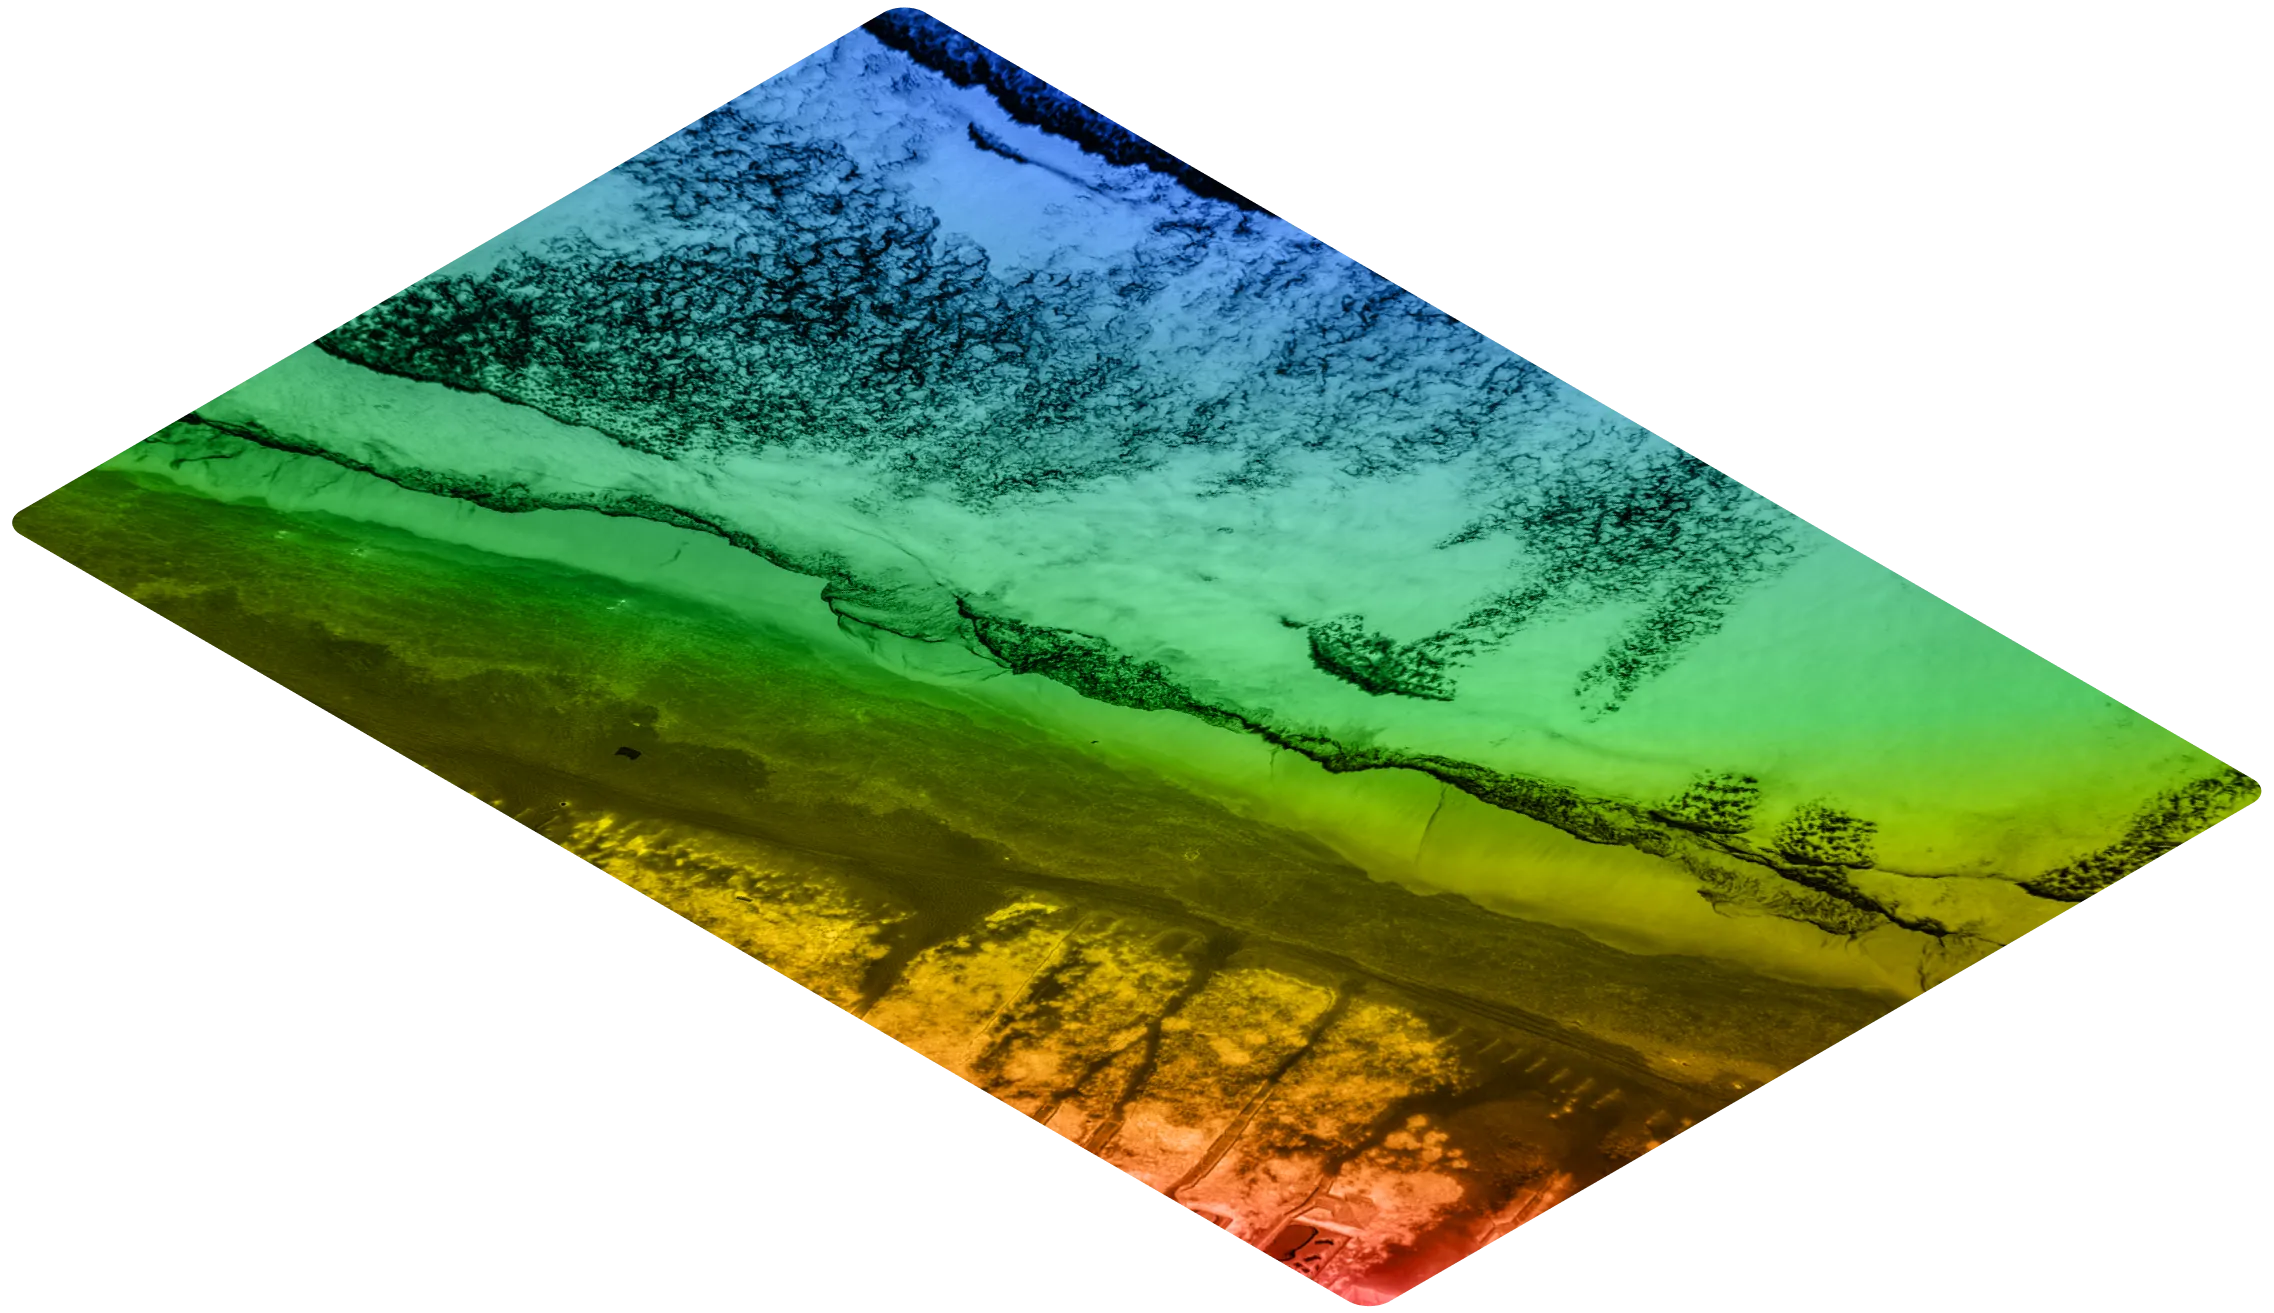
Coastal elevation
The biggest driver for accurate flood pricing
002
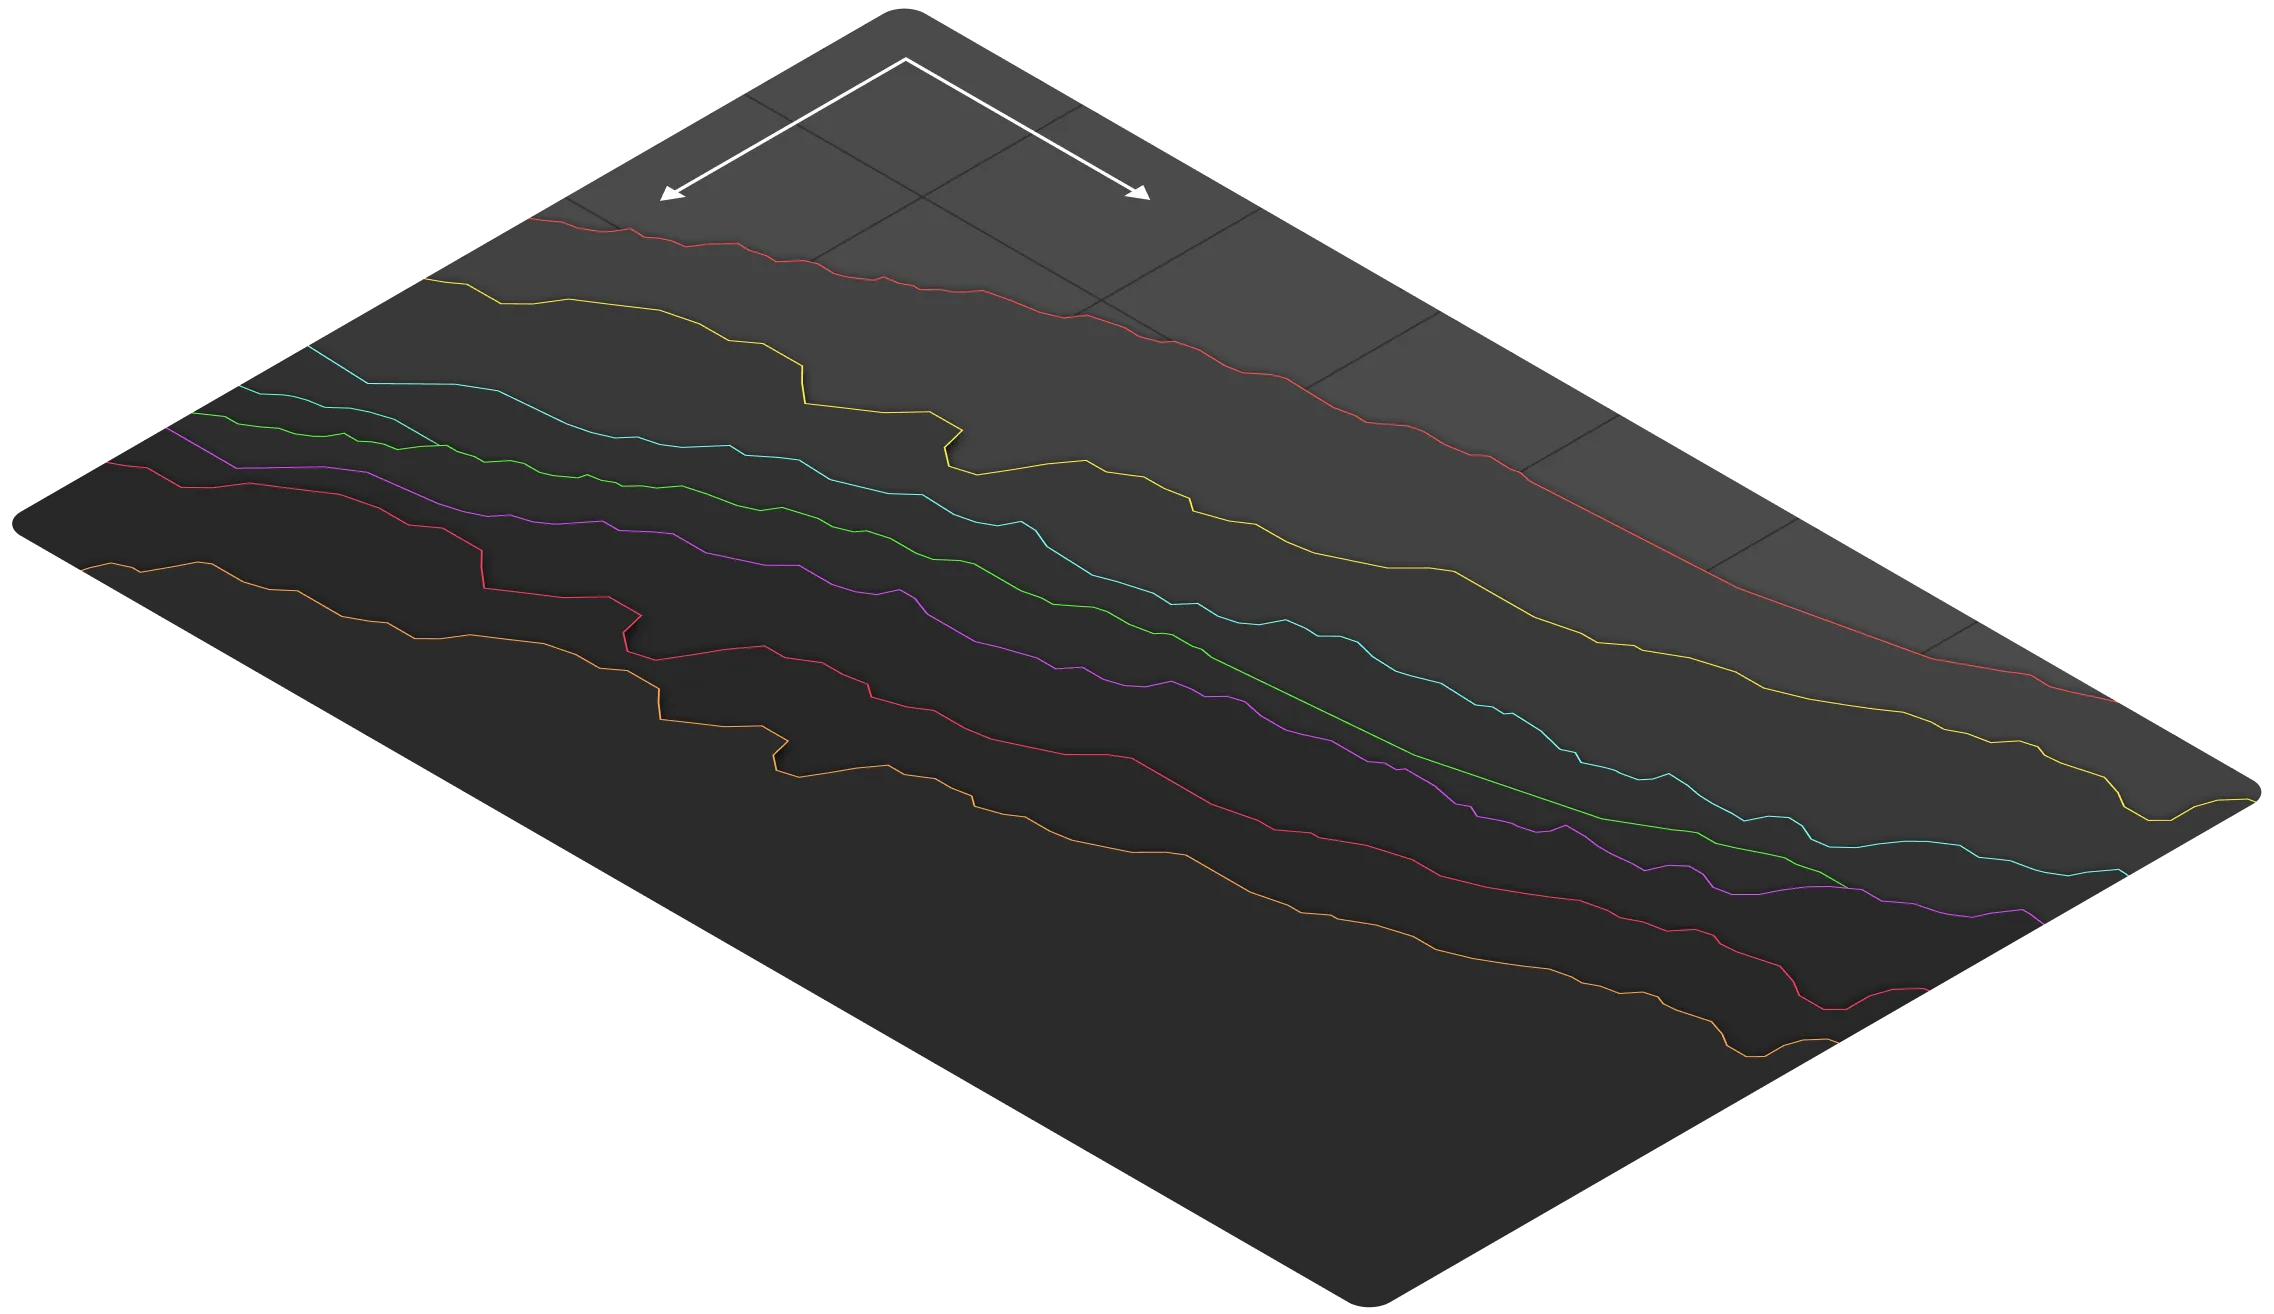
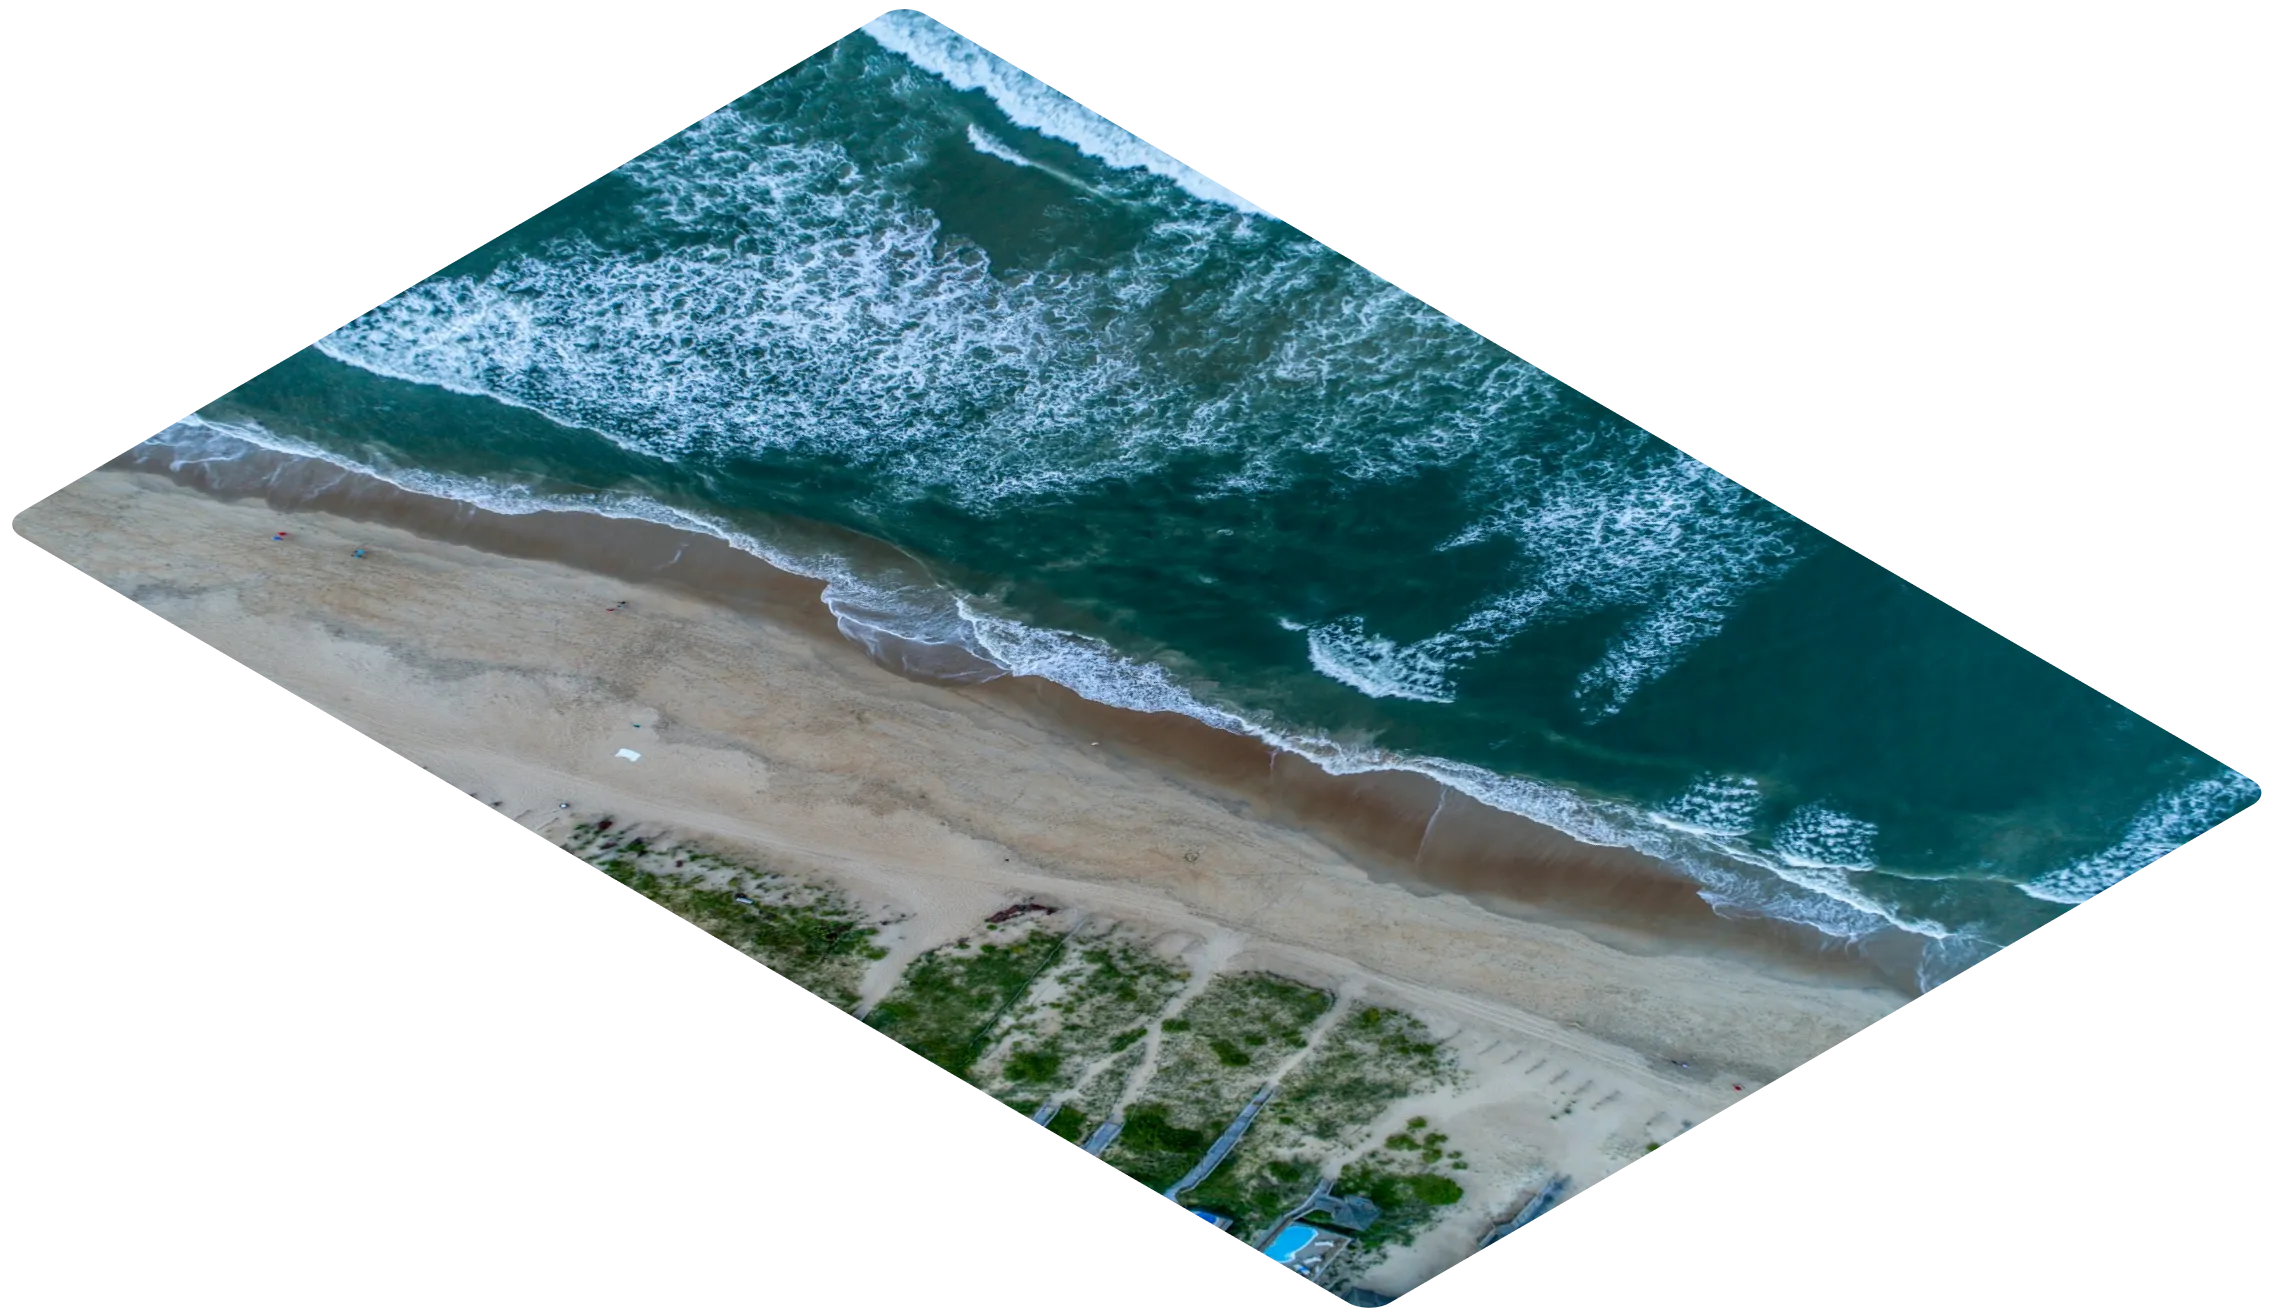
Shoreline position &
historical rate of change
Feeds the long-term risk view behind every price
003
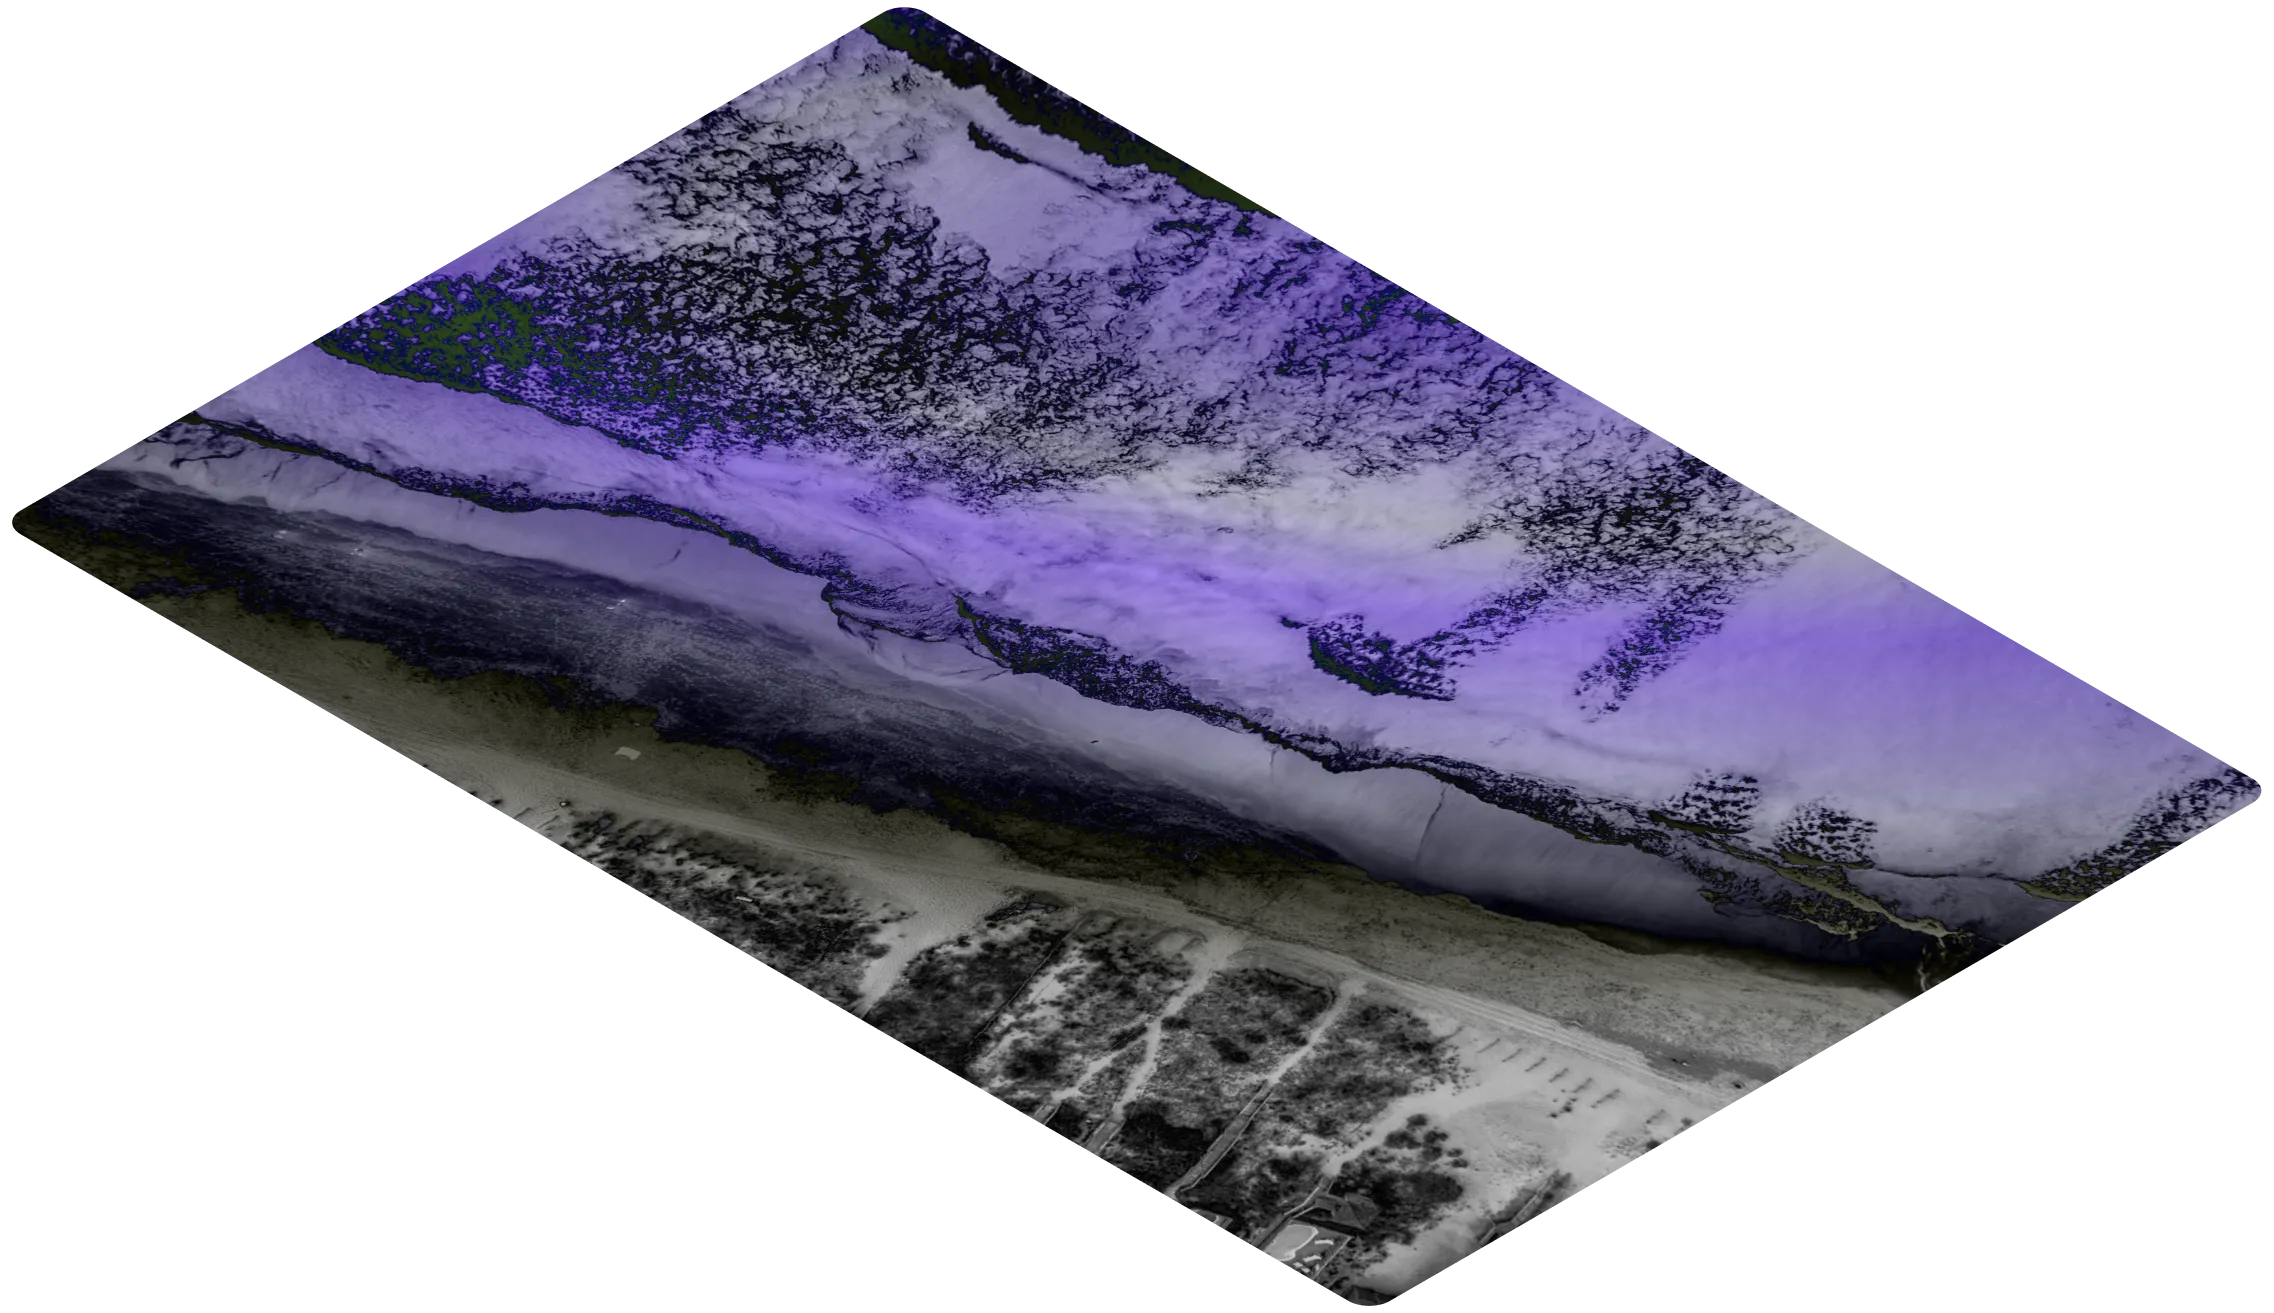
Seabed depth & movement
Sharpens flood depth accuracy, and the price behind it
004
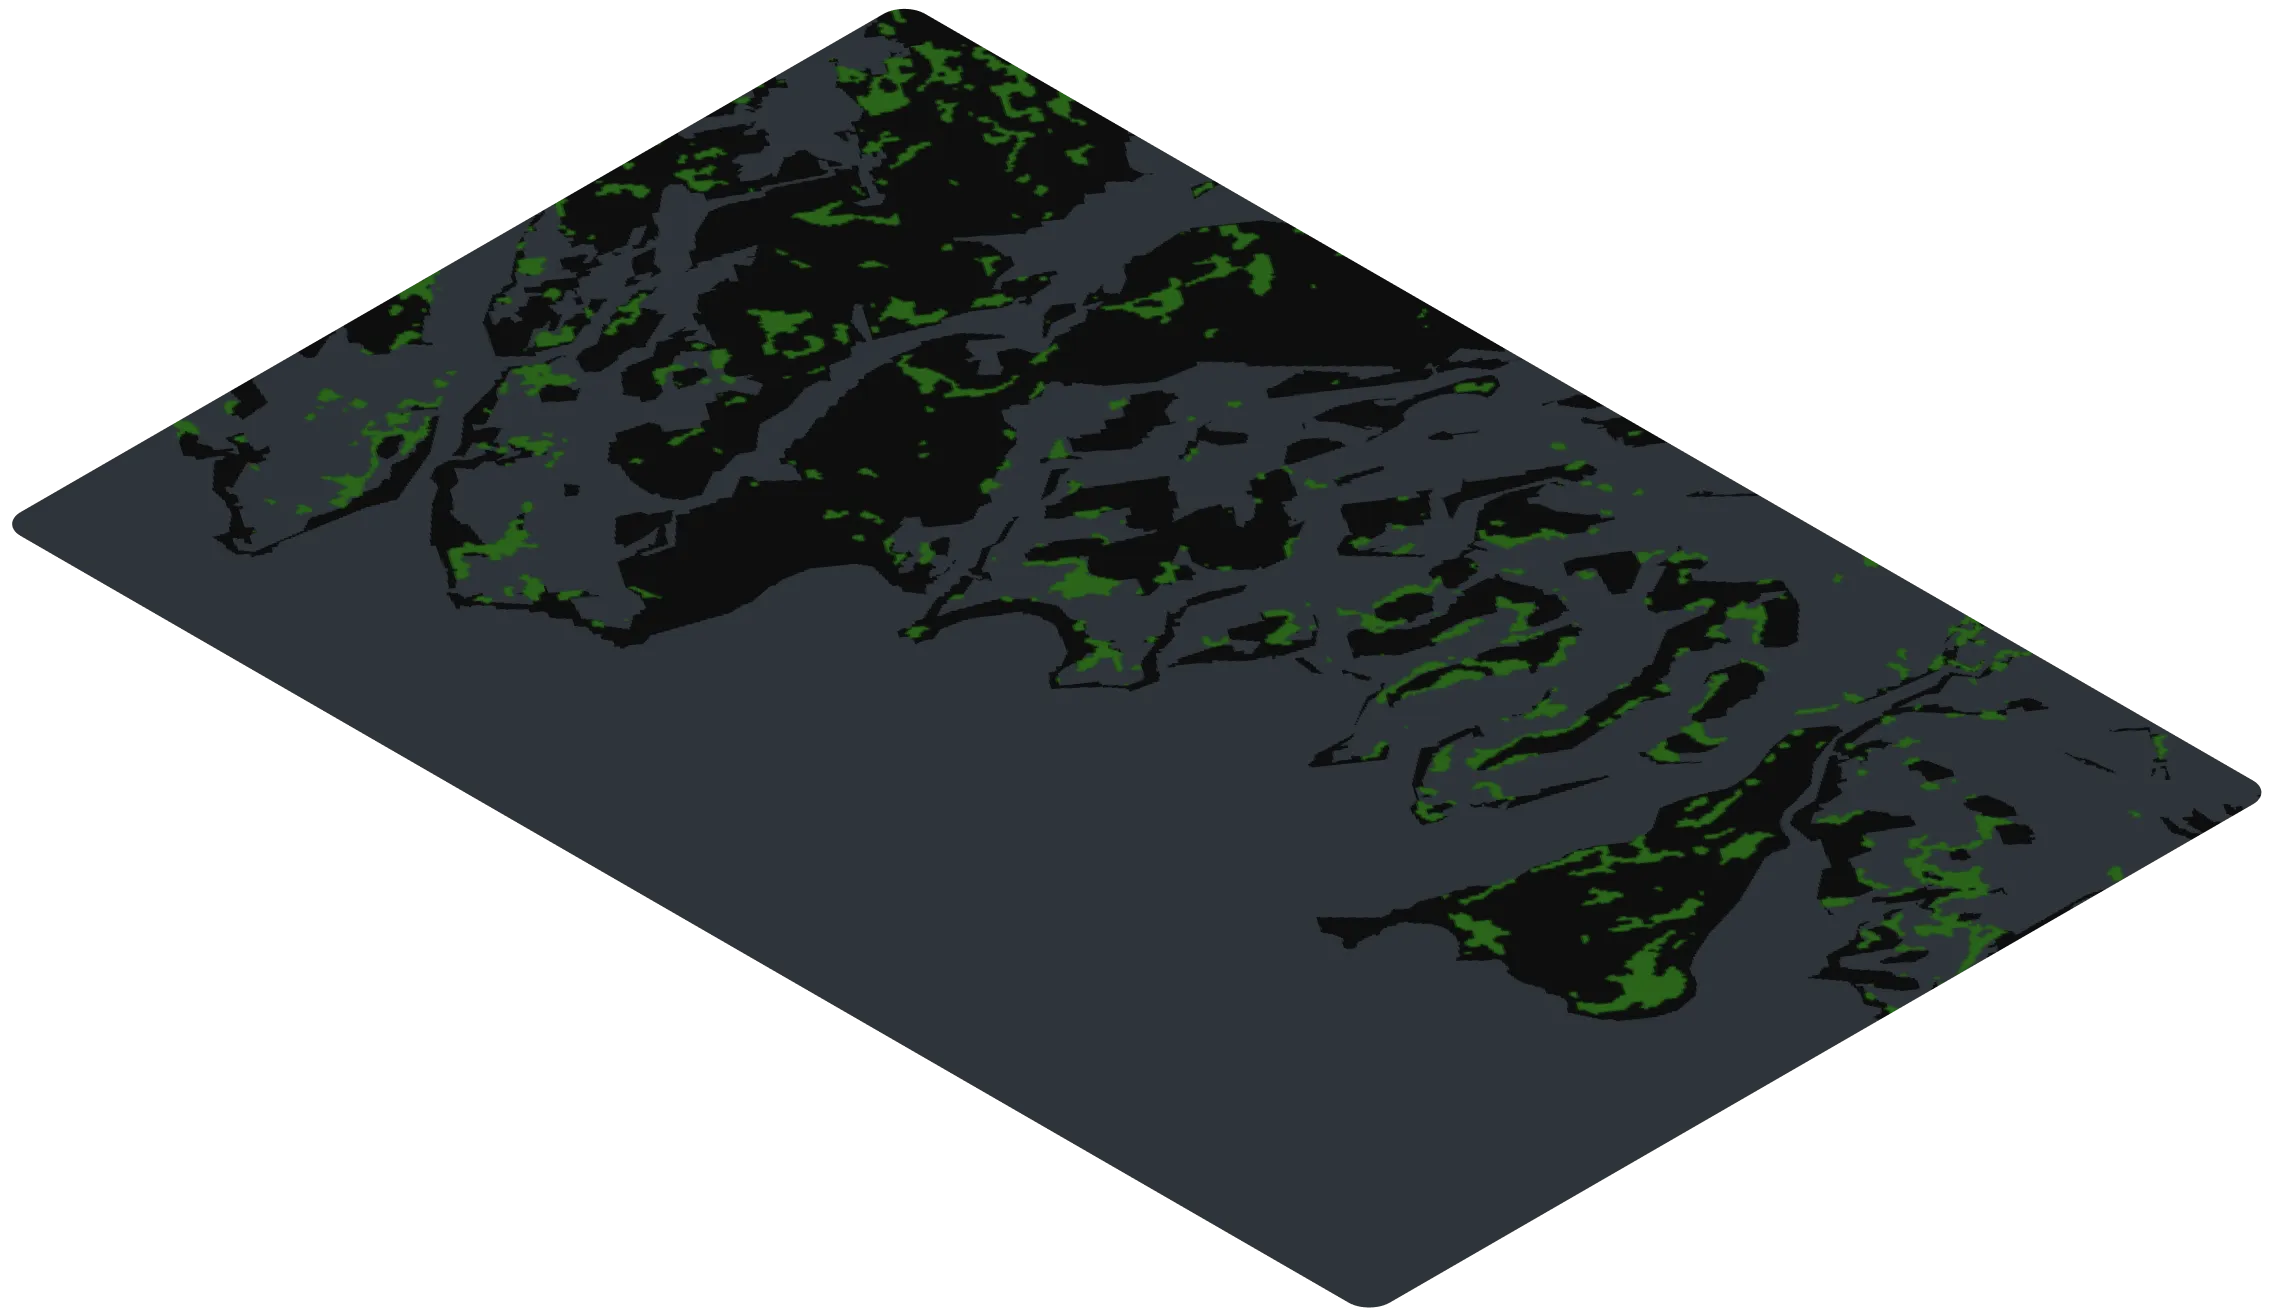
Natural defenses
Lowers the baseline risk before pricing even starts
005
Hyperlocal weather data
Keeps pricing current with real-time conditions
006
Asset vulnerability
Unlocks premium credits for hardened properties
Isometric graphic of a coastline overlaid with a data grid, illustrating Ocean Ledger's coastal elevation data layer
Isometric graphic of a coastline overlaid with a data grid, illustrating Ocean Ledger's shoreline position and historical erosion data layer
Isometric graphic of a coastline overlaid with a data grid, illustrating Ocean Ledger's seabed depth and movement data layer
Isometric graphic of a coastline overlaid with a data grid, illustrating Ocean Ledger's natural coastal defenses data layer
Isometric graphic of a coastline overlaid with a data grid, illustrating Ocean Ledger's hyperlocal weather data layer
Isometric graphic of a coastline overlaid with a data grid, illustrating Ocean Ledger's asset vulnerability data layer

Behind every quote we price: Precise, up-to-date data, validated against real-world storms, ground-truth surveys, and trusted partners.

Learn more our insurance product
Proprietary geospatial AI models and ground-truth data
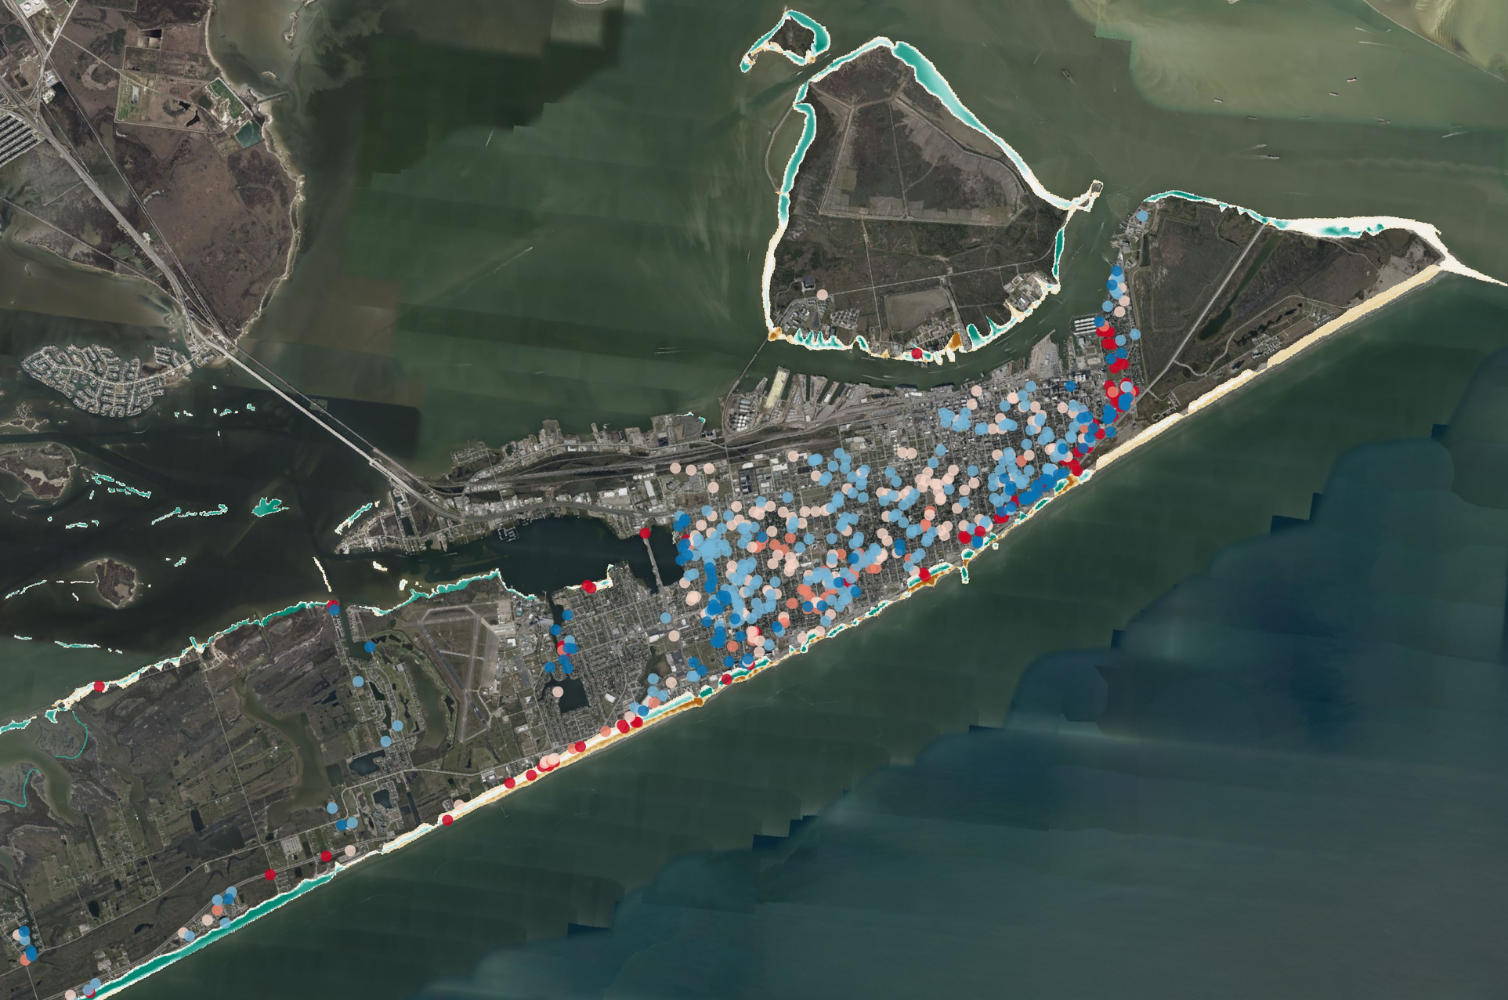
Our satellite-derived elevation and seabed data run at 1 meter resolution, refreshed annually, versus the 100 meter, 5-10 year refresh cycles of incumbent models.

Every layer is checked against real-world surveys: our seabed measurements came within 1-2 feet of an aerial drone survey, and elevation data lands within 1cm of local ground surveys on average.
Satellite map of a coastal community with colored markers showing Ocean Ledger's geospatial risk data points
Technology to support transparent pricing
Every quote comes with a clear explanation of how our risk view differs from standard catastrophe model assumptions at that location, so a lower premium always has a defensible reason behind it.

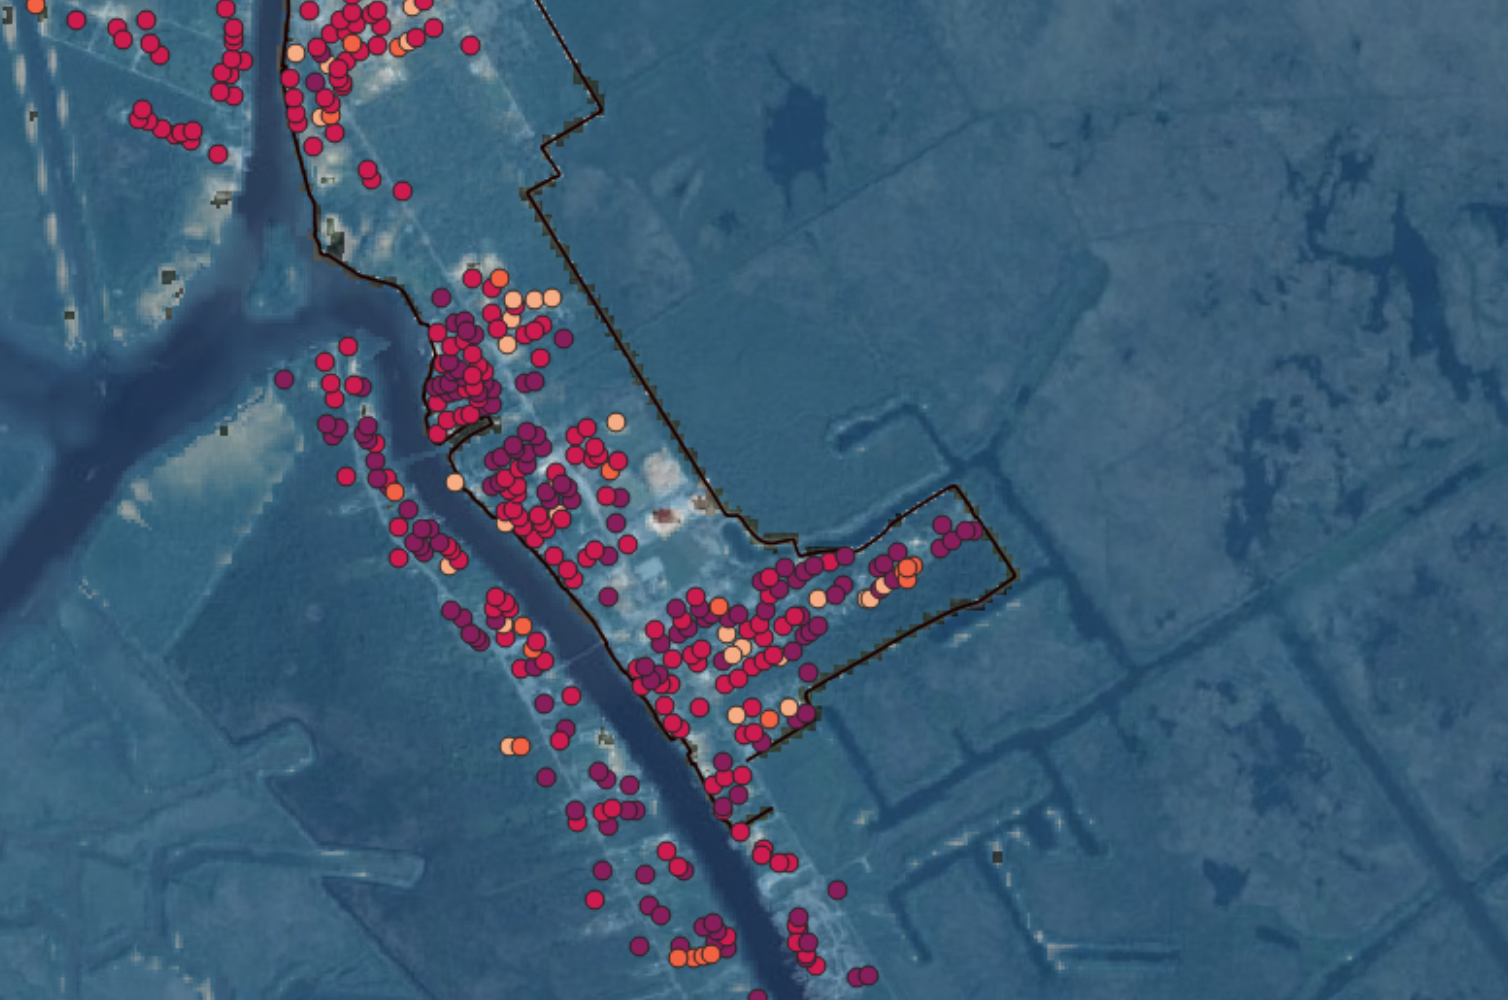
We benchmark continuously against KatRisk, RMS and Verisk, and test against real storms, our surge predictions came within 20-40cm of actual observed water levels in Hurricane Ida and Ian.
Satellite flood-risk heatmap with red and orange markers concentrated along a flooded coastal area
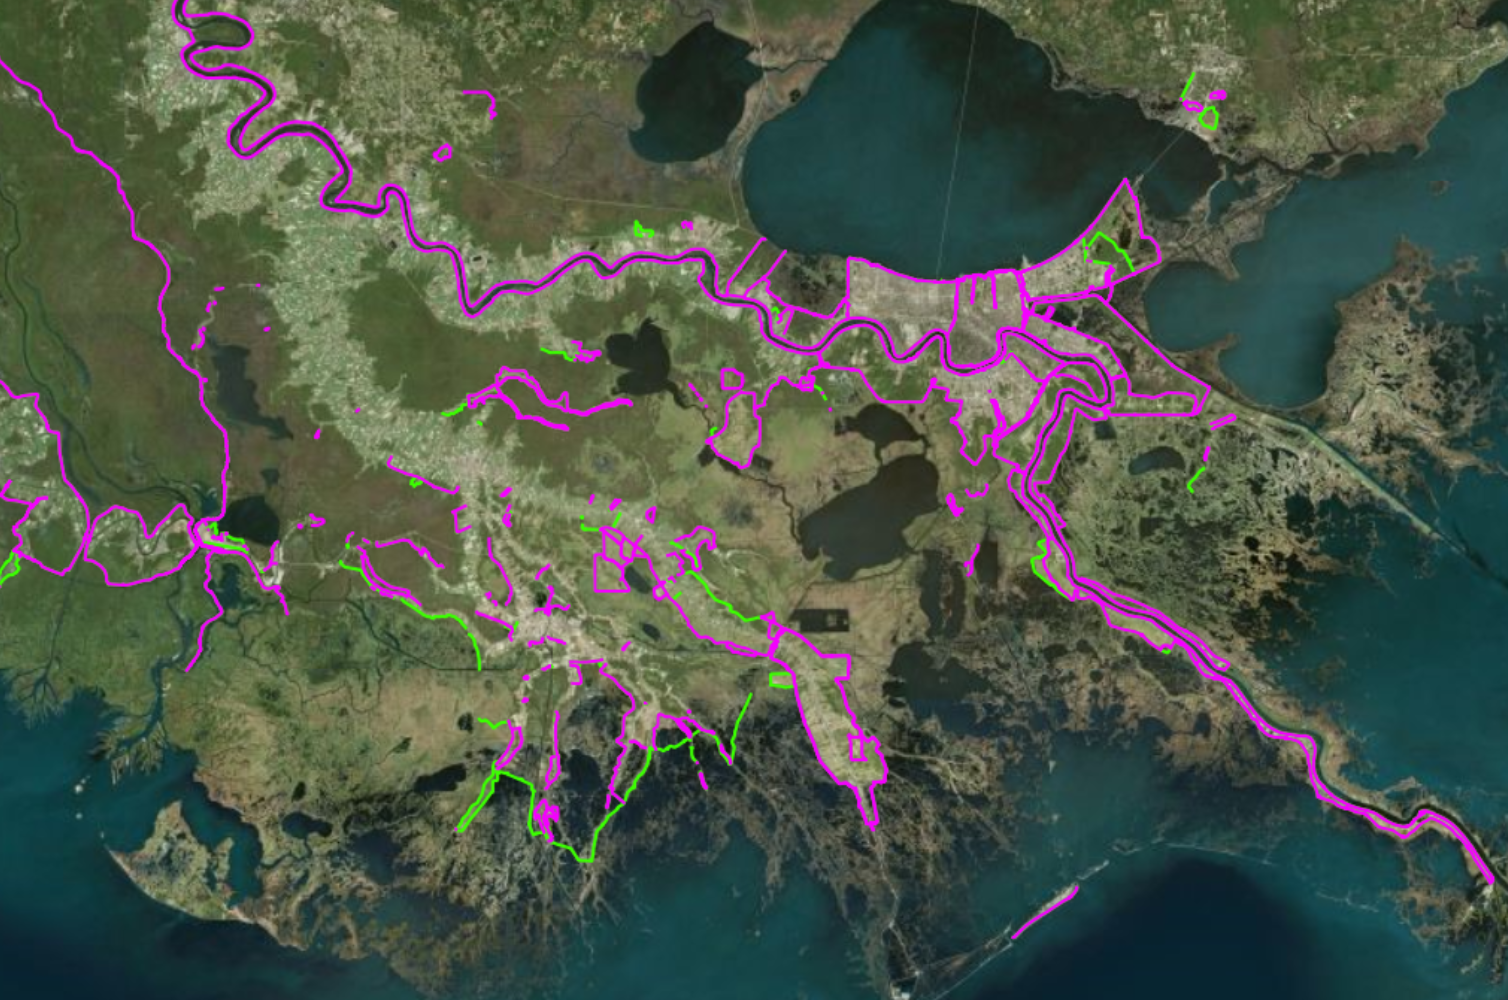
Advanced flood defense detection
We detect and verify public infrastructure (sea walls, levees, pump stations) and private hardening (flood vents, elevated utilities, dry floodproofing) using proprietary AI and imaging tools, cross-checked against submitted certificates and site data.

Verified defenses feed directly into our pricing model, unlocking premium credits of 5-25% for hardened properties.

Satellite image with green and magenta lines tracing detected coastal defenses and waterways
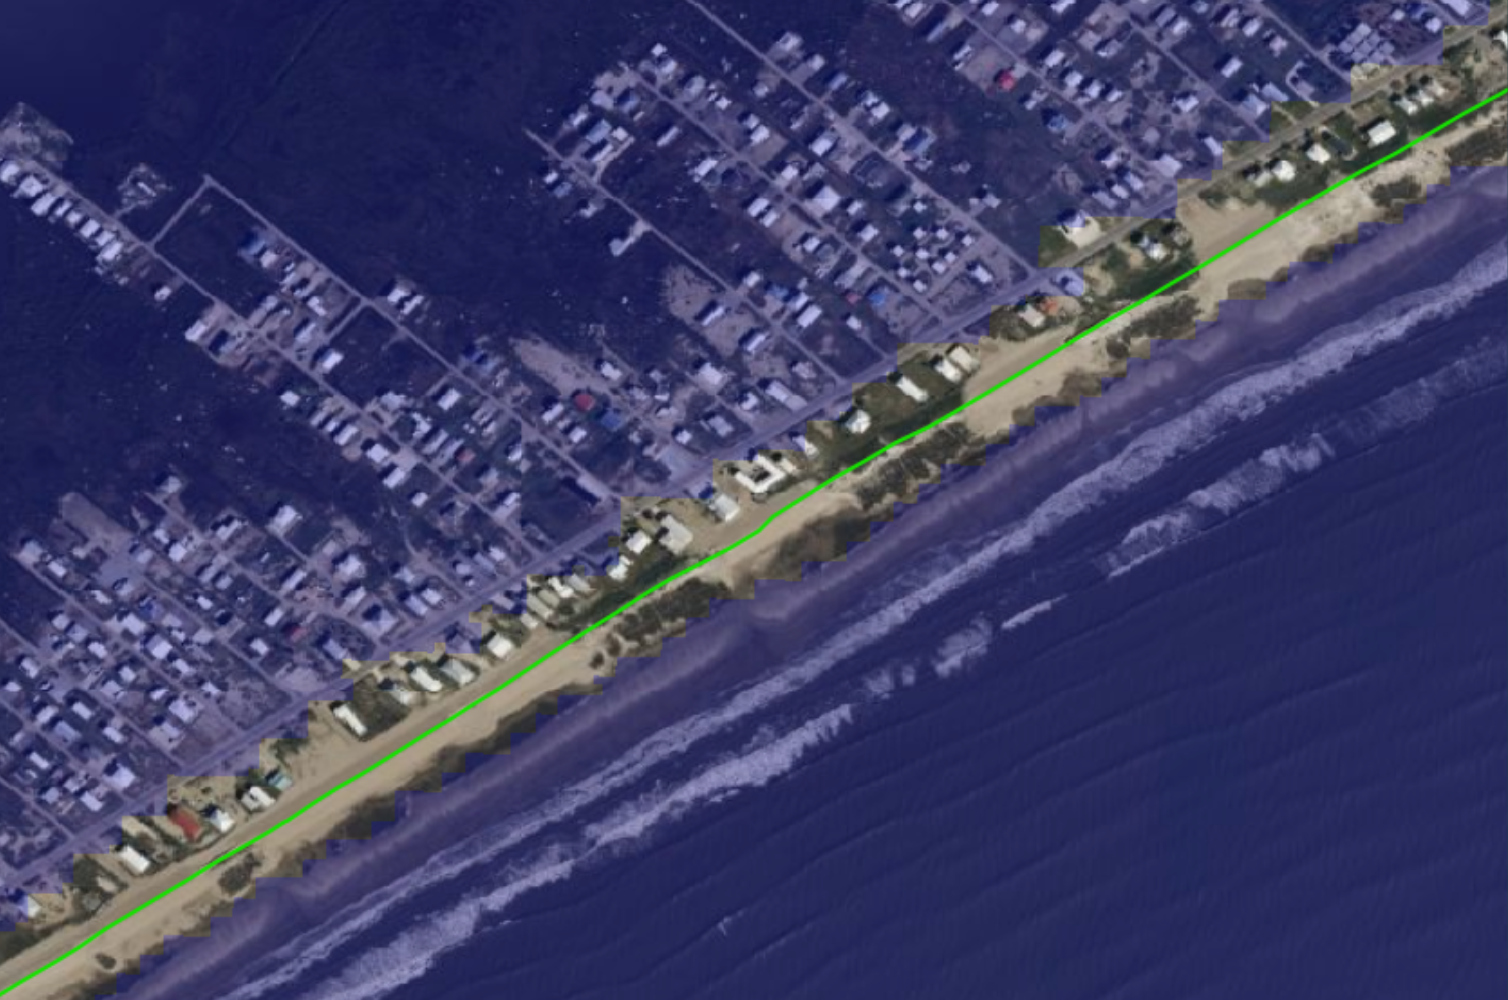
Built on a network of trusted data partners
Our models are calibrated with a growing network of partners: real-time tidal buoys and satellite monitoring track surge dynamics as they happen, while flood mitigation providers supply verified property-hardening records.

None of this data stands alone, it's built into our own risk models, sharpening the accuracy behind every quote we offer.
Satellite image of a coastal barrier island with a green line tracing the shoreline and nearby properties

Reach out to partner with us, or ask a question.

Get in touch